

OSWorld 2.0: Benchmarking Computer Use Agents on Long-Horizon Real-World Tasks
or, The Year of CUA

Originally presented as a live talk on July 8, 2026

Paper · Website · Repo · Leaderboard
Background
So, what are computer use agents?
A computer use agent (CUA) is an agent that can use a computer just like a person would: looking at a screen, mousing around, clicking buttons, using the keyboard, and so on.
Unlike most agents, which are built for purpose - coding, deep research, specific jobs like that - a CUA is general; in theory, it can do anything that is doable on a computer. The term is more about the mode of operation than the purpose.
Now practically speaking, there are limits. Like in theory, you could solve the Riemann hypothesis while using a computer, just writing down math in LaTeX. Obviously that’s not what comes to mind first when you think about a human using a computer, but it’s important to get our definitions and distributions right when we’re designing benchmarks like OSWorld.
So what folks really mean by “computer use” is more like “use of common graphical programs for white collar or personal tasks” - email, spreadsheet, CRM, shopping, stuff like that.
I want to emphasize graphical here. Agents are already quite good at using the command line and writing code for work that isn’t graphical, that is purely text. And tech companies know that, so a lot of tools that are naturally graphical for humans have gotten text interfaces for agents, or already had APIs that agents could call directly. That’s honestly preferable; after all, language is the primary medium of large language models - it’s right in the name. And while humans are good at language too, we are especially good at vision. So where we can, we want textual and graphic versions of tools available.
But sometimes it’s not possible, or at least not practical.
For one, some tasks are inherently visual. Like if you want your agent to design an infographic in Figma, or to CAD up a part, or to edit a video in YouTube Studio, you really need it to use vision. Parts of each task may be textual and thus amenable to the command line, but there’s no getting around the visual parts.
On a more practical level though, many programs that could be more textual and LLM-friendly simply won’t - the developers won’t add the features, or the admins won’t permit that type of access, or some other organizational barrier crops up. So if your agent has to be a drop-in replacement for a human, with no special accommodations, then it has to be good at computer use.
I always think of the DMV for this latter case. Like that software has gotta be ancient, and there’s no way they will overhaul their systems any time soon. So even though the work probably isn’t that inherently graphical, you probably have to deploy a CUA to automate that work - at least for now.
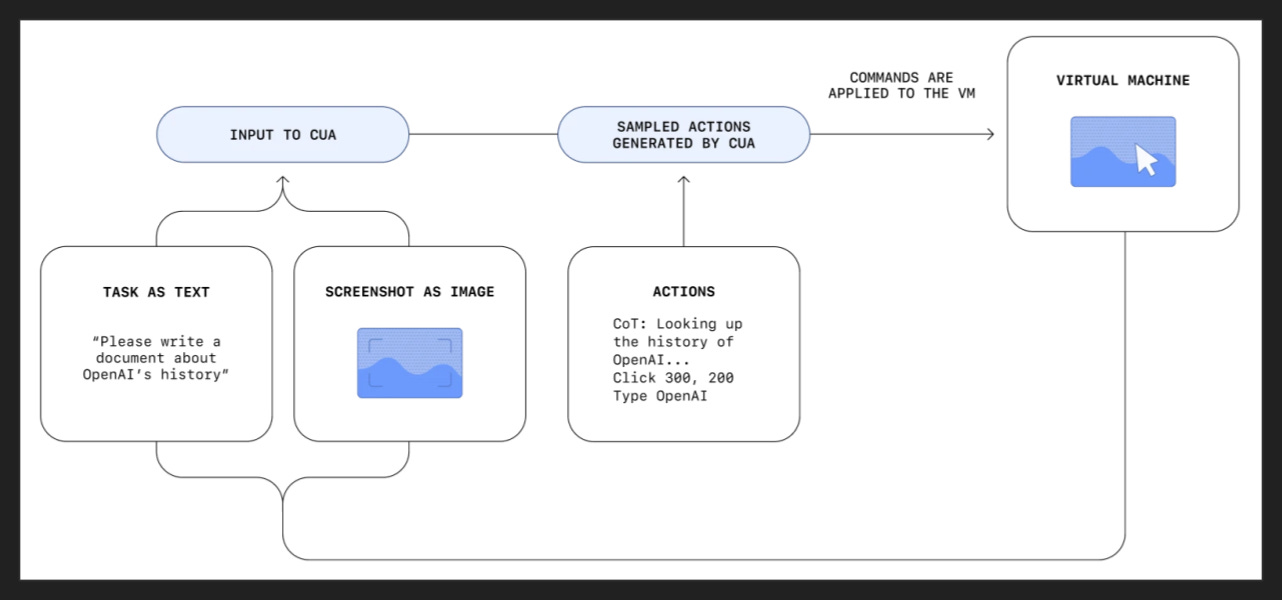
Now that we know what CUAs are, we should talk a bit about how they work, which will help contextualize some of the benchmark design decisions and failure modes we’ll see later on.
The primary way folks add computer use to their models is by feeding in screenshots. That requires a model to have vision capabilities in the first place, and there are things you can do to the screenshot to help the model, but that’s the basic approach. The model then emits pixel coordinates and actions, like “click on (148, 273)” or “drag from (318, 997) to (509, 1011)”. That’s a totally general approach, operating pretty much like a human, but it comes with a couple downsides.
For one, vision is just not that strong of a skill for most models. They miss some details and fabricate others, at a higher rate than with text. Labs care more about text generally.
For another, vision is token-intensive. A single screenshot, optimized for computer use, is roughly in the low thousands of tokens. That’s not much on its own, but if you want anything like real-time vision, that’s going to add up quickly. In fact, that token cost is a major reason computer use tends to happen with smaller models. (The other reason is speed.)
Now the other approach folks sometimes use is to read some lower-level representation of what’s on screen. This is mostly relevant for browser tasks, where the model can read the DOM, which is basically the code that the browser translates into something visual for the user. If you’ve ever done “inspect element” in Chrome and then edited some of that code to make something change on the page, you know what I’m talking about. Another example here is the accessibility tree (or “a11y tree”), which originally was for vision-impaired humans to use while operating a computer.
The lower-level representations are nice when you can get them, and many agents do take a hybrid approach, but many programs don’t have them. And of course some things are still inherently visual, so no lower-level representation can do them justice. So pure vision is inescapable to some degree.
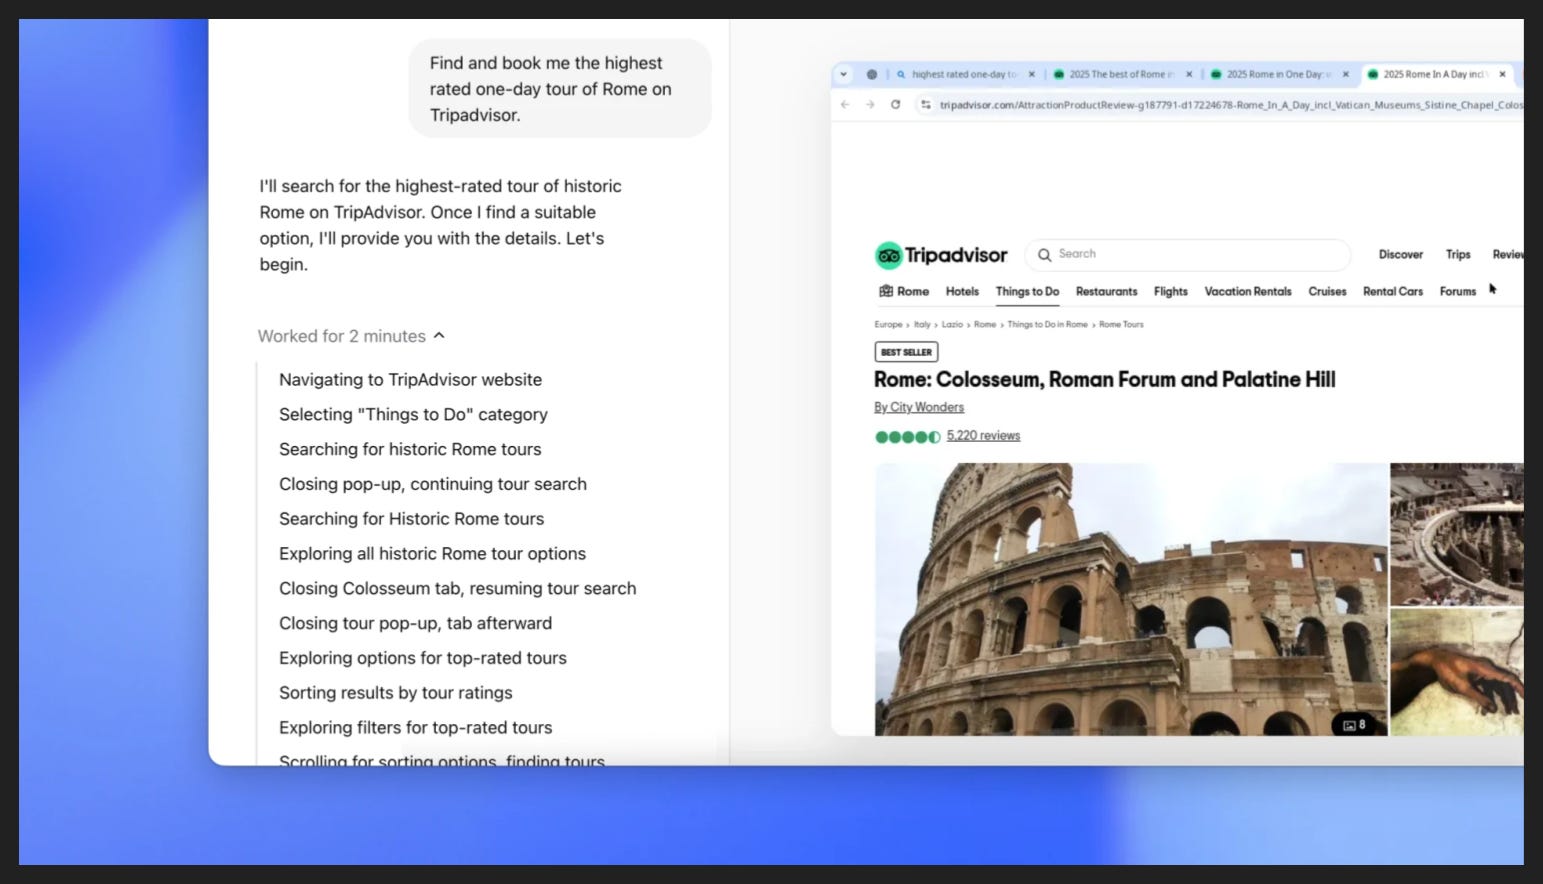
Weirdly, even though computer use in many ways is behind compared to other areas of AI, computer use agents appear fairly early in the Gen AI era.
For example, Anthropic released its first CUA in October 2024, alongside a new version of Sonnet 3.5. It didn’t release Claude Code until February 2025, alongside Sonnet 3.7. Similarly, OpenAI released its first CUA, Operator (shown here), in January 2025; it didn’t release its coding agent, Codex, until April 2025.
Usually it’s benchmarks that come first though, kind of setting the target that the model makers need to go out and hit. And to that end, the first CUA benchmarks of the era appeared in 2023, not long after ChatGPT came out. For example, Mind2Web, which came out in mid-2023, comprised 2,000 tasks across 137 real websites, but offline versions. Since no real vision-equipped model had come out yet, the CUA navigated the DOM. There were a couple vision-only benchmarks, like Android in the Wild, but they used bespoke vision encoders rather than the general vision encoders on a vision-language model like you’d find today.
Once GPT-4V came out in September 2023 though, the door for truly general CUA benchmarks was wide open. One of the earliest, and certainly the most enduring, was OSWorld.
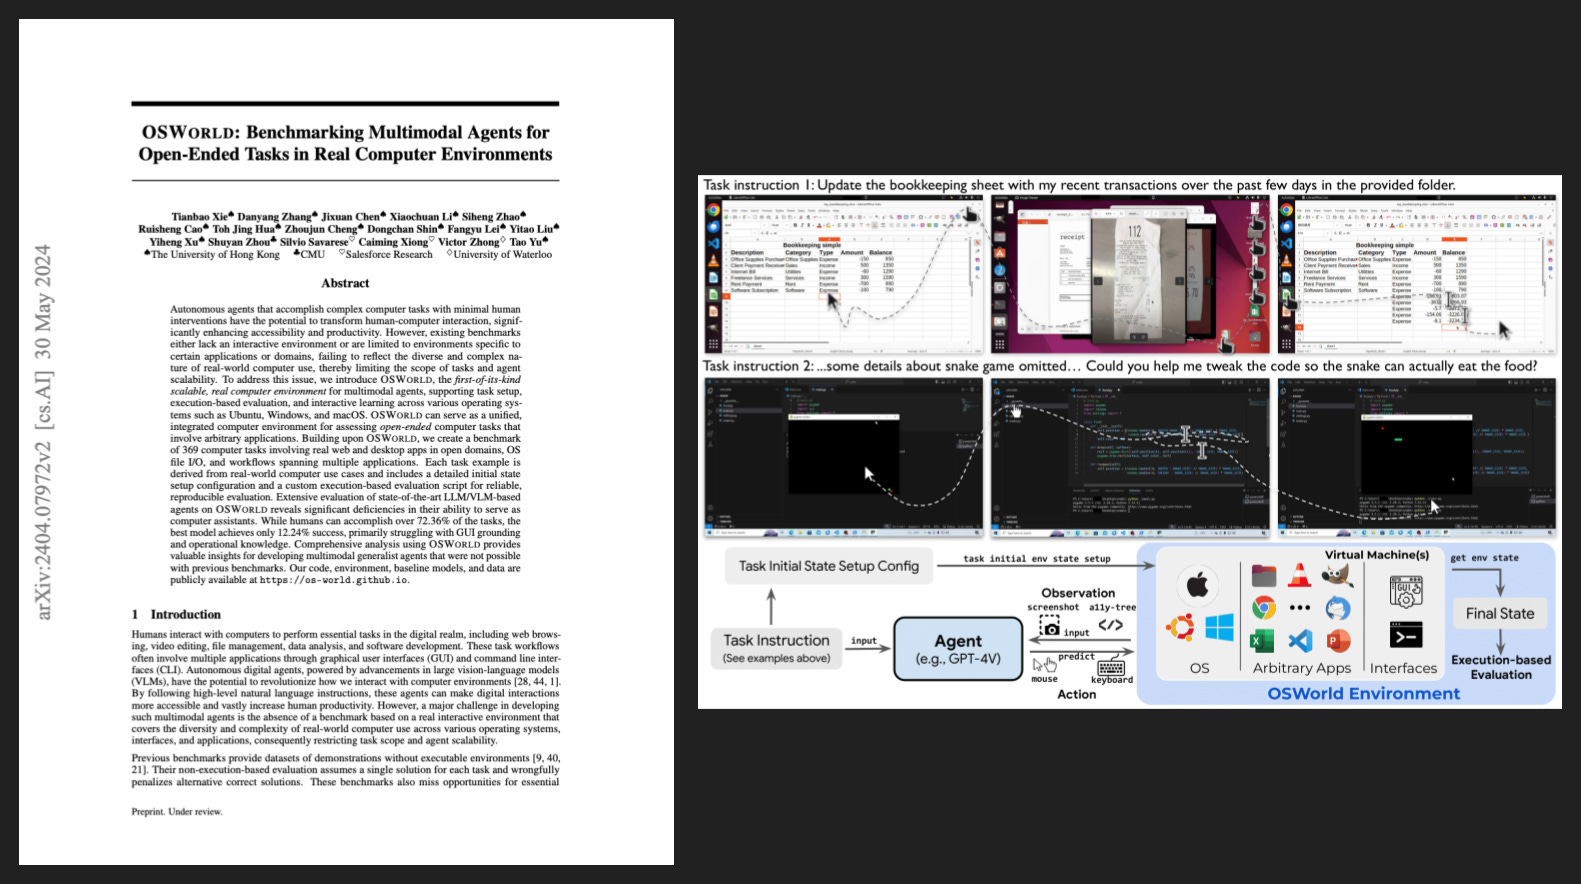
In that early crop of CUA benchmarks, a few things made OSWorld stand out.
For one, it was supremely general: it plopped the CUA in a Linux or Windows or macOS desktop, with all the normal programs, and just gave it a task. It was the first benchmark to really say, “this is what computer use should look like”.
Not only was it general, it was also cross-program. For example, in the first task over there on the right side, you can see the agent switching between a spreadsheet and an image viewer. The entire computer is “in bounds” so to speak, the benchmark isn’t contained to a single program that happens to be running on a computer, in an operating system etc.
Another key element was the engineering behind it. The OSWorld folks built some nice infra, allowing other researchers to replicate and build on their efforts. The paper emphasizes their approach to virtual machines and environments and initial state setup, all topics that still matter today. And of course, if the teams building models can use your infra, of course they’re going to run evals on your infra.
So as a result, OSWorld became the standard computer use benchmark. Anthropic has reported results since it released its first CUA, and so has OpenAI. Google started reporting with the release of Gemini 3 Flash. All of them continue to report on it today, although technically the later results are on a cleaned-up version called OSWorld-Verified.
The first CUAs were understandably terrible, scoring no higher than about 12%, while humans scored 72%. However, there was remarkable progress in 2025, and by early 2026 the leading models all hit human parity. So now is the perfect time for OSWorld 2.0.
The Paper
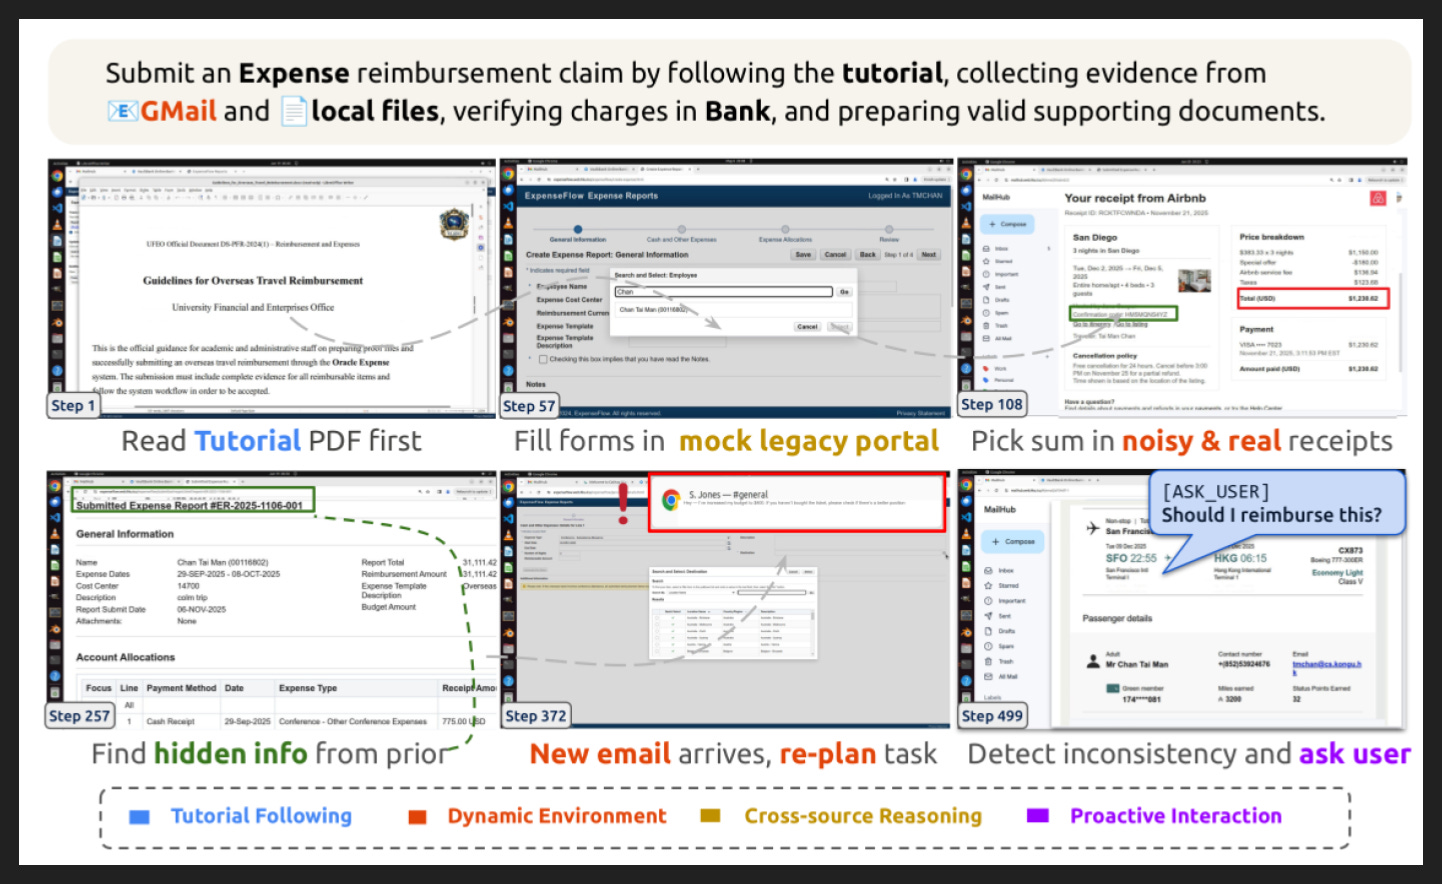
Let’s start with a concrete example from OSWorld 2.0, keeping the examples from OSWorld 1.0 on the previous slide in mind.
High-level it’s a straightforward request: read some reimbursement instructions and apply them to this specific case. Not terribly different from that first example task in OSWorld 1.0.
However, several differences emerge upon closer inspection. For one, just look how many steps there were - the last screenshot says Step 499! That’s way longer than anything in OSWorld 1.0 as we’ll see when we look at duration and step distributions.
Another key difference is the number and variety of programs. Here we have a PDF reader, an expenses portal, and email. For OSWorld 2.0, not only did they add more programs like FreeCAD, Blender, and Obsidian, they also added 31 self-hosted websites - clones of Gmail, Slack, LinkedIn, Salesforce, Twitter, Eventbrite, YouTube and more. It’s a nice example of how AI coding progress unlocks progress in other areas of AI.
OSWorld 2.0 also introduces a new taxonomy of work types - what they call “challenge phenomena” - to describe more specifically what the agent has to accomplish along its trajectory. It’s hard to compare the whole list directly with OSWorld 1.0, but some are certainly new, like the Dynamic Environment example in step 372; new information arrives while a task is underway, and the agent has to notice and incorporate it.
Overall, OSWorld 2.0 is harder: longer, more novel, and with more wrinkles.
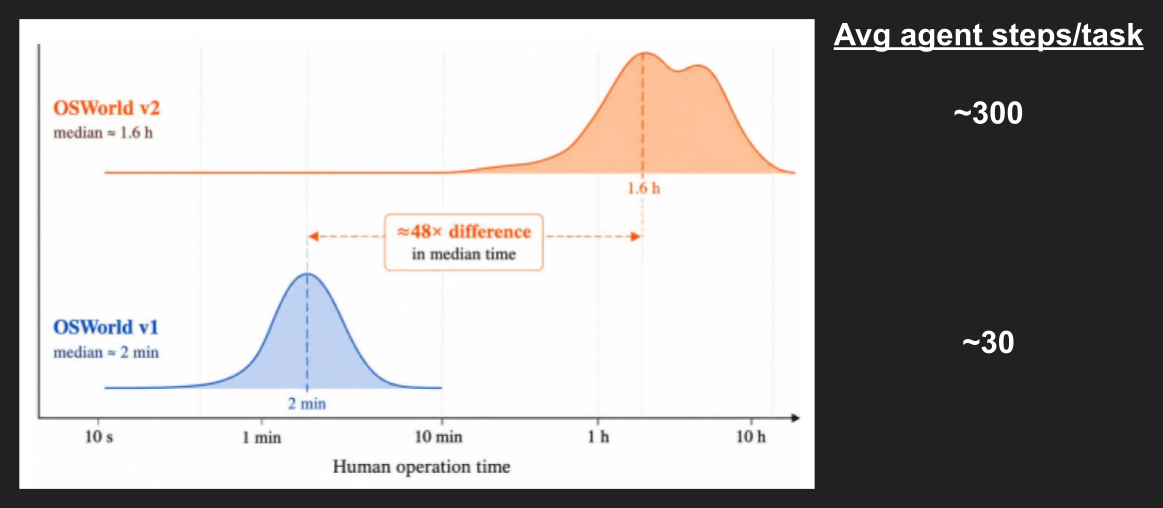
Here’s a closer look at how much longer they made the tasks. It’s measured in human operation time, i.e. how long it takes a competent human to complete the task.
Keep in mind this is a log scale, so the difference is more dramatic than it might visually seem. I’ll also note the significant right-hand tail, where the top 50% of tasks by length are more spread out and reach past ten hours in a couple cases. The net impact on agents is about a 10x increase in steps, whether successful or not.
Another way to read this is an indication of CUA time horizons. OSWorld 1.0 came out in April 2024, and two years later it basically saturated, meaning it took two years for models to be pretty reliable at tasks taking a single-digit number of minutes. With OSWorld 2.0, published at the end of June 2026, we are ready to measure tasks taking a single-digit number of hours. This is the closest I’ve seen to a GUI version of the famous METR time horizons graph.
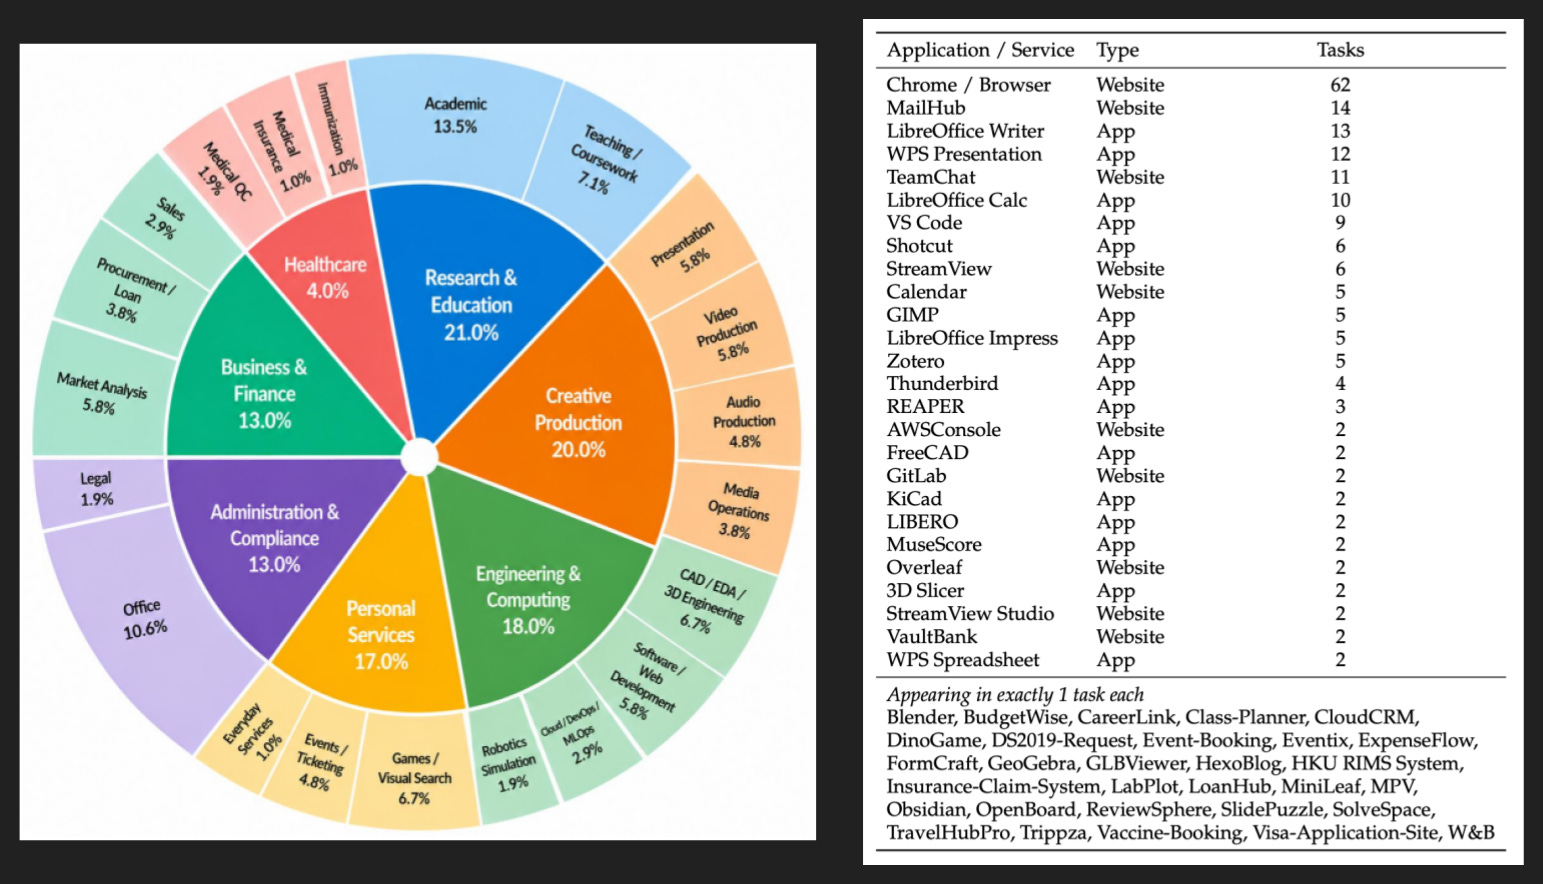
Moving from length to novelty, we get a couple breakdowns of what the tasks are asking for and what tools they entail.
On the left, they give a breakdown by domain, with categories somewhat influenced by economic sectors. They spend some time in the paper trying to tie their domains to various slices of GDP, but it seems more like an add-on to compete with explicitly economically-oriented benchmarks like Remote Labor Index and GDPval. You can read more about that category of benchmarks in my breakdown of Agents’ Last Exam, which the authors actually cite as a “close comparison” but without the focus on graphical tools. Anyway, the tasks do take more inspiration from the real world, and the shift from scientific framing to economic framing indicates to me how close to production CUAs are - or will be, once they can climb this benchmark.
On the right is a more concrete breakdown, this time by program used. Note that most tasks require at least two programs, so the total here is well over the 108 total tasks in the benchmark, and they mention elsewhere that the average count of programs per task is 2.44.
Anyway, we see a browser is required for a majority of tasks, with equivalents for Word, Powerpoint, and Excel rounding out the double digits. MailHub and TeamChat are Gmail and Slack, respectively, and they happen in the browser so there’s actually some double-dipping between them and Chrome/Browser. Regardless, most of the programs and all the web apps are new in OSWorld 2.0, so still an impressive increase in novelty.
Now given there are only 108 tasks in the benchmark, it’s not surprising to see so many programs appearing only once, but such small sample sizes in so many domains does make me hesitate on any fine-grained analysis. As we know, it’s expensive to produce good benchmarks in significant quantities!
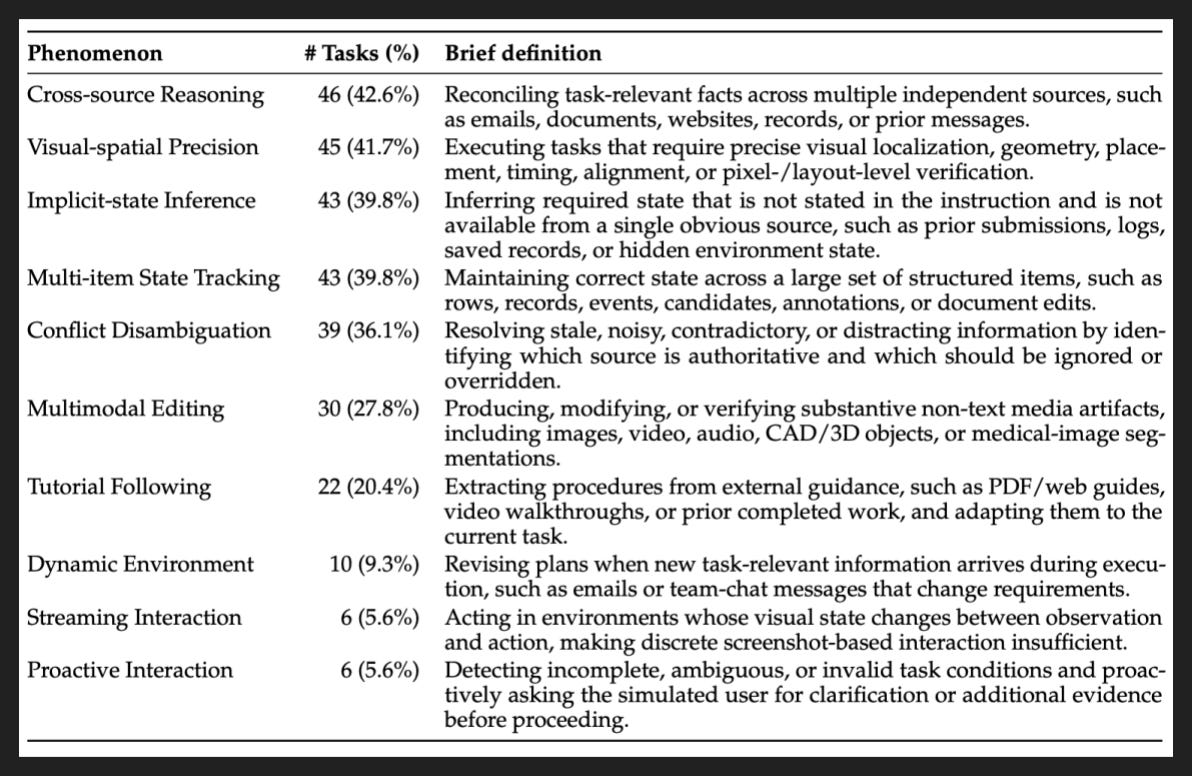
And turning to the wrinkles, which themselves are often novel, we again get a table of overlapping entries; as we saw in the example slide, a task has many challenge phenomena.
The names are fancy, but the concepts are pretty simple. In fact, I think most people would have a hard time parsing these challenge phenomena out if you asked them to document the difficulties in their own computer use trajectories. But as we know, artificial intelligences are jagged, and things we find easy are often hard for agents - and vice versa.
Right near the top is one about vision and perception, which we could have anticipated as being quite common. And just above it, Cross-source Reasoning, is a wrinkle they consciously introduce to turn up the difficulty compared to OSWorld 1.0, so no surprise it’s at the top.
But the next few I find more interesting. You would think that with such large context windows and such great intelligences, models would be better at inferring and tracking and deciding which conflicted source takes precedence. But as we’ll see in the results slides, models still struggle to process such information.
The rest are less interesting or less common, but I wanted to show them all here since they will all appear later on.
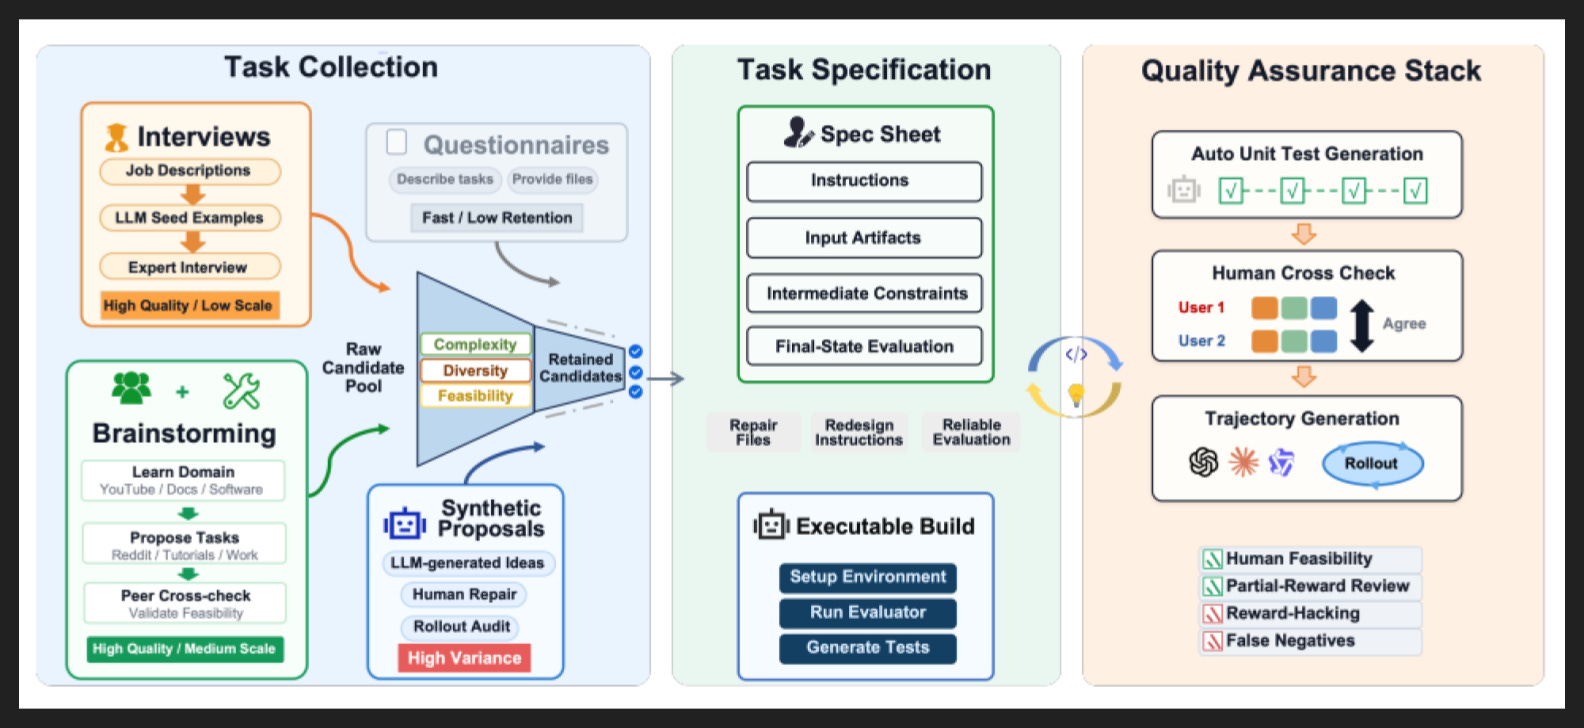
Now before we get to the results, of course I wanted to highlight their pipeline.
Coming into the paper, I expect them to harvest existing artifacts and then reverse engineer tasks out of them, but that’s actually not what they did. Instead, their main method of task creation was what they call “brainstorming”, in the green box toward the bottom-left. I’m going to quote their description directly:
“The bulk of OSWorld 2.0 tasks were produced by a small group of internally trained annotators who worked end-to-end on the tasks they proposed, covering task design, input artifact construction, environment setup, and evaluation function implementation. Annotators first learned the target domain by watching tutorials on YouTube, reading official documentation, and directly experimenting with the software, which equipped them to reason about professional tools and workflows, or enterprise systems in sufficient depth. They then drafted candidate tasks grounded in workflows surfaced from Reddit discussions, online tutorials, and their own day-to-day work experience, with each draft specifying the instructions, required input artifacts, and expected final state. Every candidate was finally peer cross-checked by a second annotator, who reviewed it for feasibility, redundancy with existing tasks, and ambiguity in the evaluation criteria… This channel ultimately produced approximately 90% of the final tasks.”
Once they have the task inputs, or “spec sheet” as they call it, they turn them into an environment with an initial state that an agent can enter into and complete the task within. So thinking back to our example task from the top, they have to put the instructions PDF on the desktop, populate the inbox with relevant and possibly irrelevant emails, log the user into the reimbursement portal, etc etc. That’s a human-led process, and in that process some holes in the initial task design emerge.
One other key step here is defining and running the evaluator, which checks for correctness at the end but also along the way. The details are somewhat opaque, but they have many so-called “checkpoints” per task, just over 27 on average. The checkpoints don’t prescribe an order, so different paths that end up at the same state are valid. Mostly the checkpoints are automatically verifiable, like whether a certain value ended up in a database, but some do require model judgment - about 11% of all checkpoints, with no task having more than 50% model-judged checkpoints. Also, they don’t use the term “rubrics” to describe it, but basically that’s what they write for the model judge to use.
So now with a completed build, they test it. First they have two humans test it and check for agreement, then they have some agents test it. If it turns out the task isn’t solvable given the inputs and the environment, or there are ways to cheat, or the checkpoints don’t fully reflect the completed state, they send it back for rework.
Overall I think it’s a decent pipeline, and I’m not surprised they got most of their tasks from human rather than synthetic inputs; models tend to produce contrived and arbitrary tasks, with clumsy additional constraints to increase difficulty.
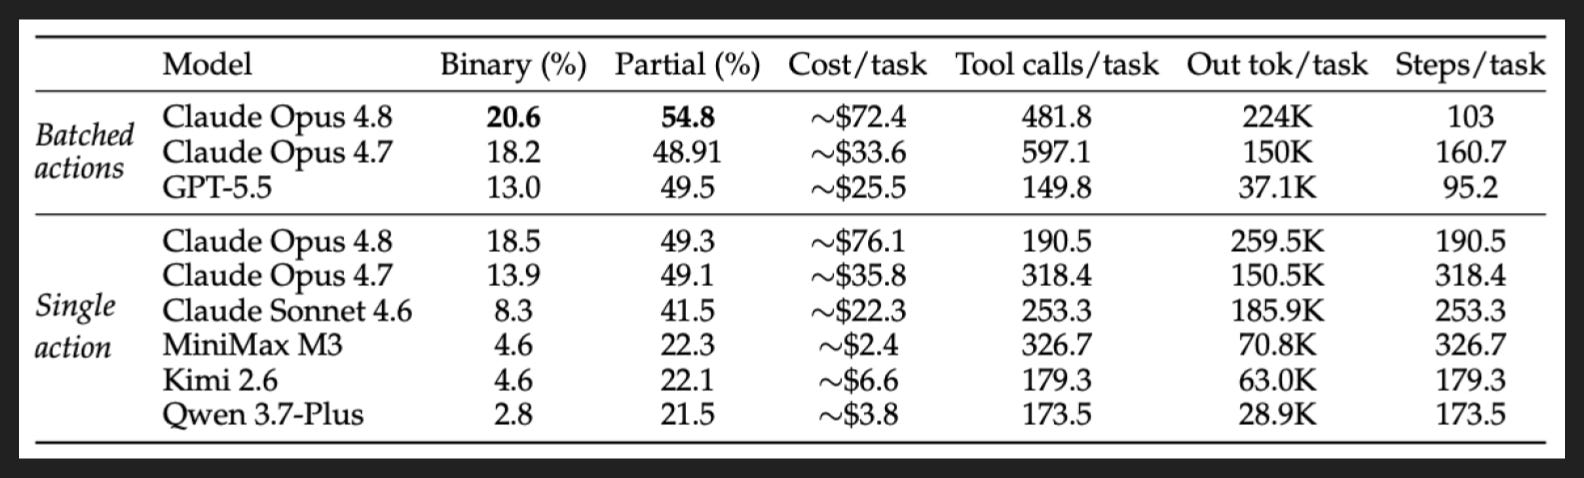
So with our 108 tasks in hand, we can now evaluate some models.
A couple notes before we dive into the table. First, this is for a budget of 500 steps. They do also provide results for 150- and 300-step budgets on their website, but they focus on the max budget setting so that’s where we’ll focus too.
Second, we should define some terms. On the columns, Binary means the share of tasks where the model got every checkpoint. Partial means the average score per task. Note that it does not mean the share of all possible checkpoints achieved across all tasks, because that would favor tasks with higher numbers of checkpoints.
On the rows, Batched means that the model took multiple actions in a step before observing and thinking about the results, whereas Single means the model looked and thought about each action before deciding on another one. GPT-5.5 only offers batched.
So with definitions out of the way, we can see clearly that Opus 4.8 is the absolute performance champion. However, that title comes at a cost, with more than double the cost for pretty marginal gain against Opus 4.7. GPT-5.5 meanwhile is the efficiency king, with far lower cost and especially output tokens per task. Opus and GPT used the highest thinking settings, so really the story here is GPT seems more efficient with its thinking tokens.
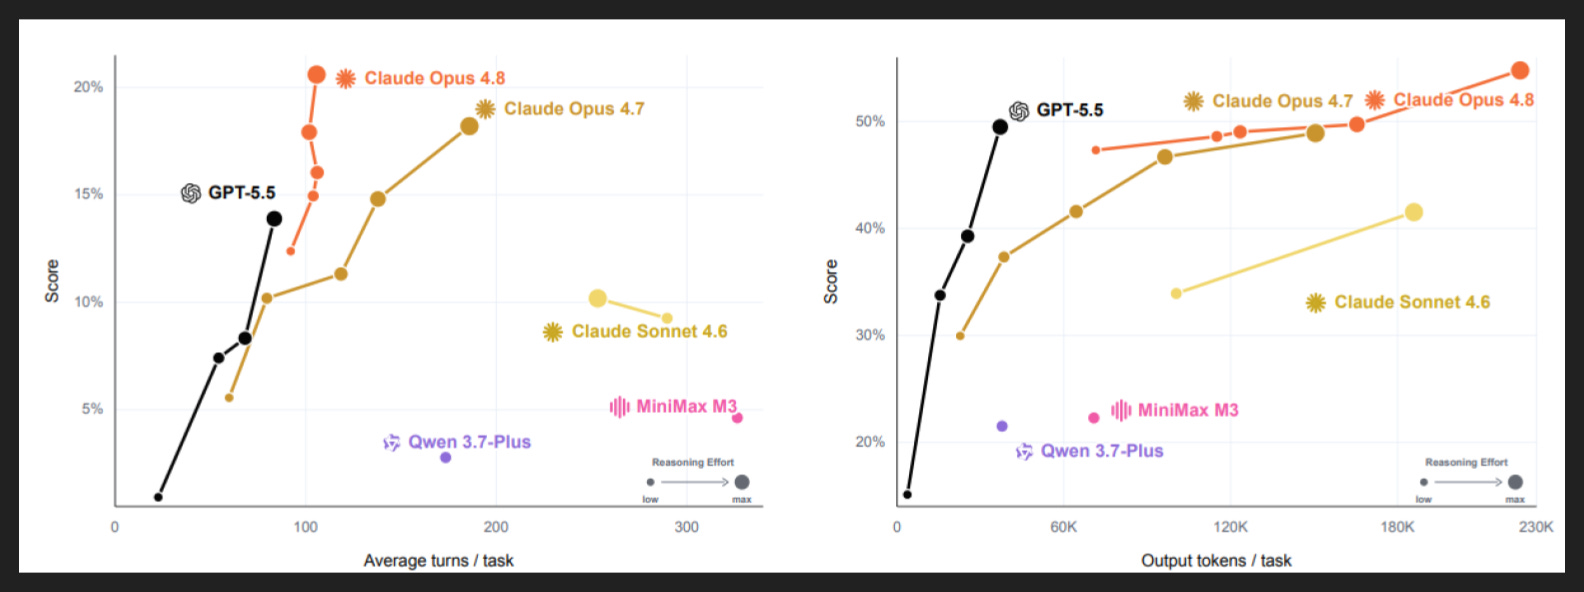
Digging in on this point, they have a couple graphs showing how thinking level impacts outcome. The bigger the dots, the higher the thinking level.
If you measure turns, then it seems more thinking quickly produces better results for the frontier models. Given some of the failure modes we’ll see later, more turns typically means the model noticed or realized something it had to do while in the middle of a task, and that less intelligent or less hard-thinking models let a lot of that subtlety slip.
If you measure tokens though, suddenly the story muddies. For GPT, our efficiency king, more thinking continues producing better results quickly. But for Opus, especially Opus 4.8, the curve is pretty flat. Since output tokens are the main driver of cost, GPT may be the better model, but only if you can accept partial results; note the change in y axis, with Binary for the left graph and Partial for the right. Bit of an odd choice by the authors in my view.
One comparison I wish they showed is on wall time. It’s tricky to compare between models, since different companies have different serving infrastructure, but ultimately what we should care about in economic terms is the rate of completed work per time. Then you can compare the dollar value of that completed work to the dollar cost of the job, and ultimately come to a net income per time. It’s another example where I feel the economic framing they tried to add with the GDP tie-in and comparison to Agents’ Last Exam is half hearted.
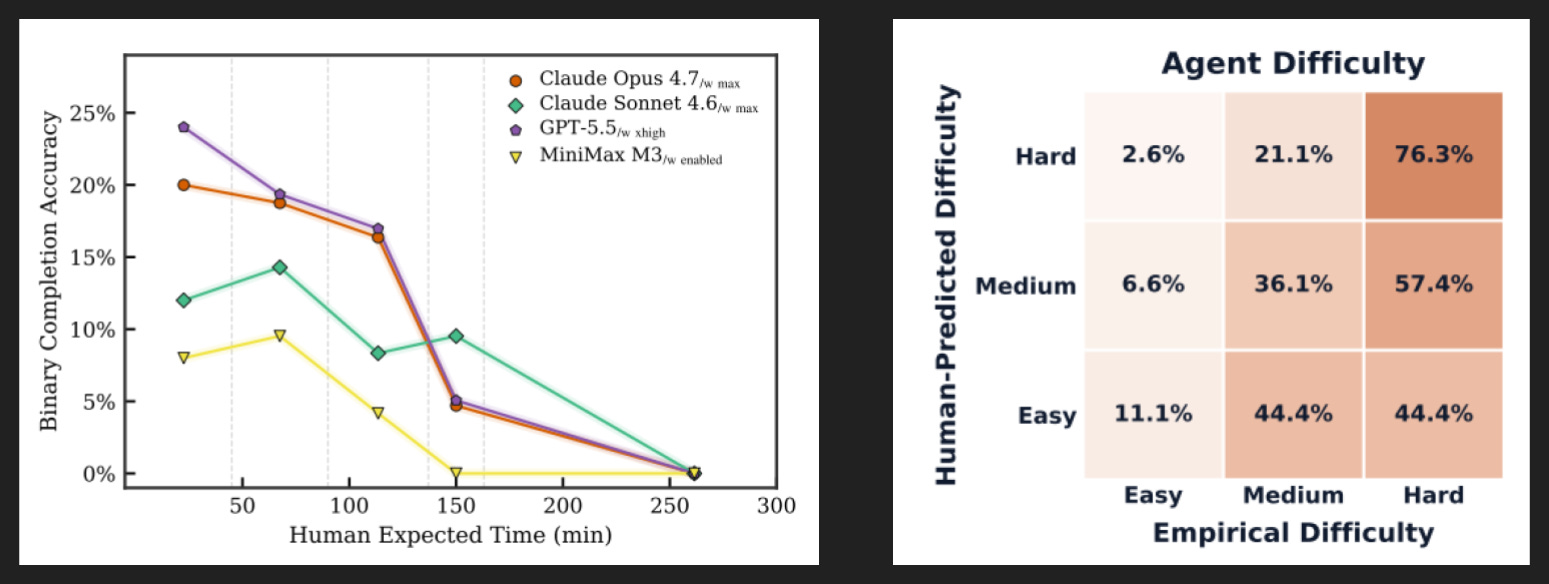
Speaking of time, the human-measured time horizon pretty well correlates with difficulty for the models, as we see on the left.
Similarly, on the right we have human-measured difficulty in three buckets: easy, meaning it took a human under 30 minutes; hard, meaning it took a human more than two hours; and medium, falling between 30 minutes and two hours. If we then bucket tasks by model Partial score - over 70% for easy, under 30% for hard, in between for medium - we see a similar correlation. As expected though, it’s much more common for an easy human task to be a hard model task than vice versa. Do note that percents are normalized by row though, so you really have to read it as “for a given human-predicted difficulty, what was the spread of empirical difficulty?”
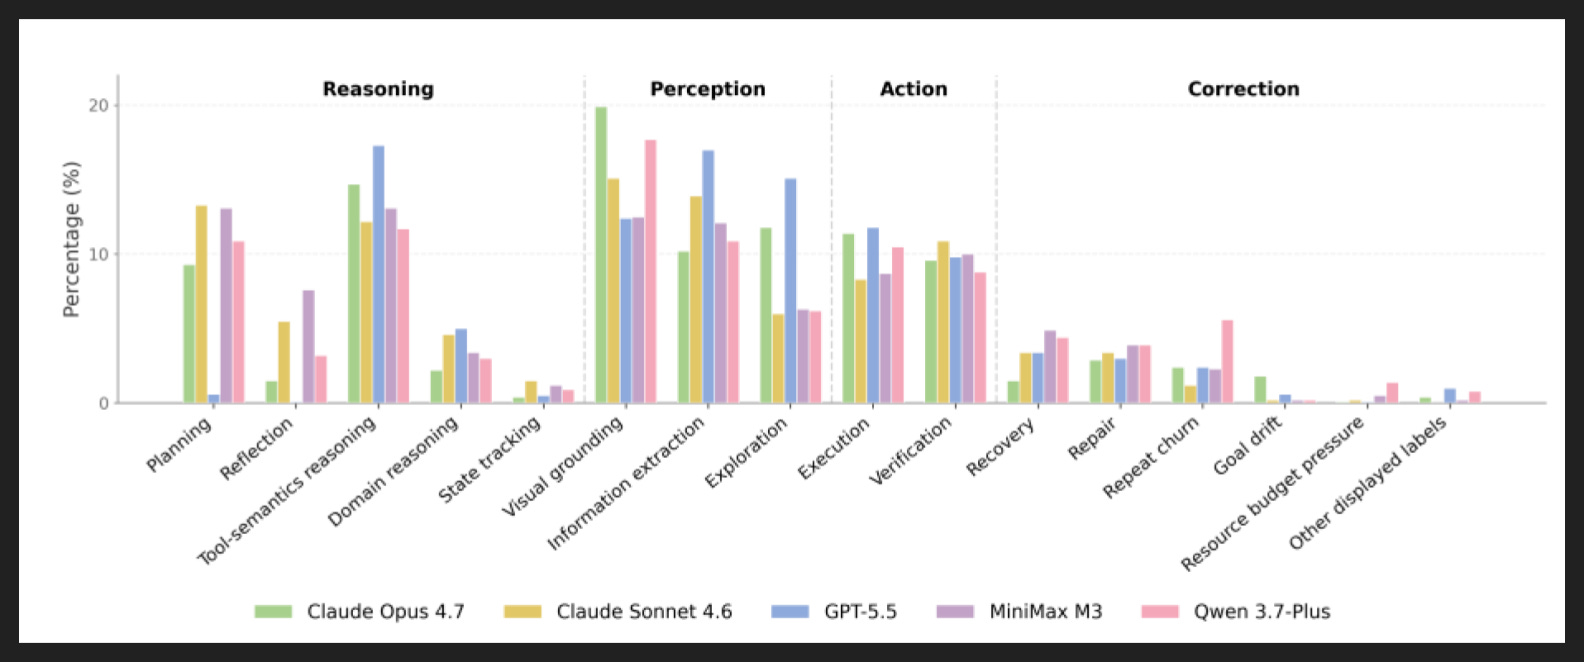
Now beyond the top-level statistics, it’s instructive to see what exactly the agents are doing in their trajectories.
Here the researchers had GPT-5.5 review all the trajectories and categorize each step, with some human review afterwards. They provide 15 categories, grouped into four phases.
A couple patterns stick out to me. One is how similar most of the models are across phases and even across categories for the most part. Like if you take any of the models and sum across phases, it’s roughly 30-35% Reasoning, 30-35% Perception, 20% Action, and 10% Correction.
Relatedly, the models likely spend too little time on correction. Obviously the ideal is for a model to never make mistakes in the first place, which would also produce very low numbers for Correction, but as we know from the top-line results these models are far from perfect. Any regular user of agents knows they tend to be overconfident, so no surprise here, but error correction and reflection are increasingly important as the horizon lengthens; the more steps you take, the more likely you are to introduce an error, and if it propagates without correction you are virtually guaranteed to fail any task past a certain length.
Two is how different GPT is on a category level. I suspect some of it is due to GPT also being the judge, but the extra exploration, information extraction, and tool-semantics reasoning does seem like a substitute for the missing planning - a more efficient substitute, apparently. Relatedly, they show in another chart that GPT greatly favors text interfaces over graphical interfaces, and pretty doggedly looks for the text version of an interface. When it works, it works well and is typically more efficient, but it’s also brittle. The authors give the example of manipulating the DOM rather than interacting with a website graphically, which is more direct but also obscures layout-based information and cuts out helpful guardrails.
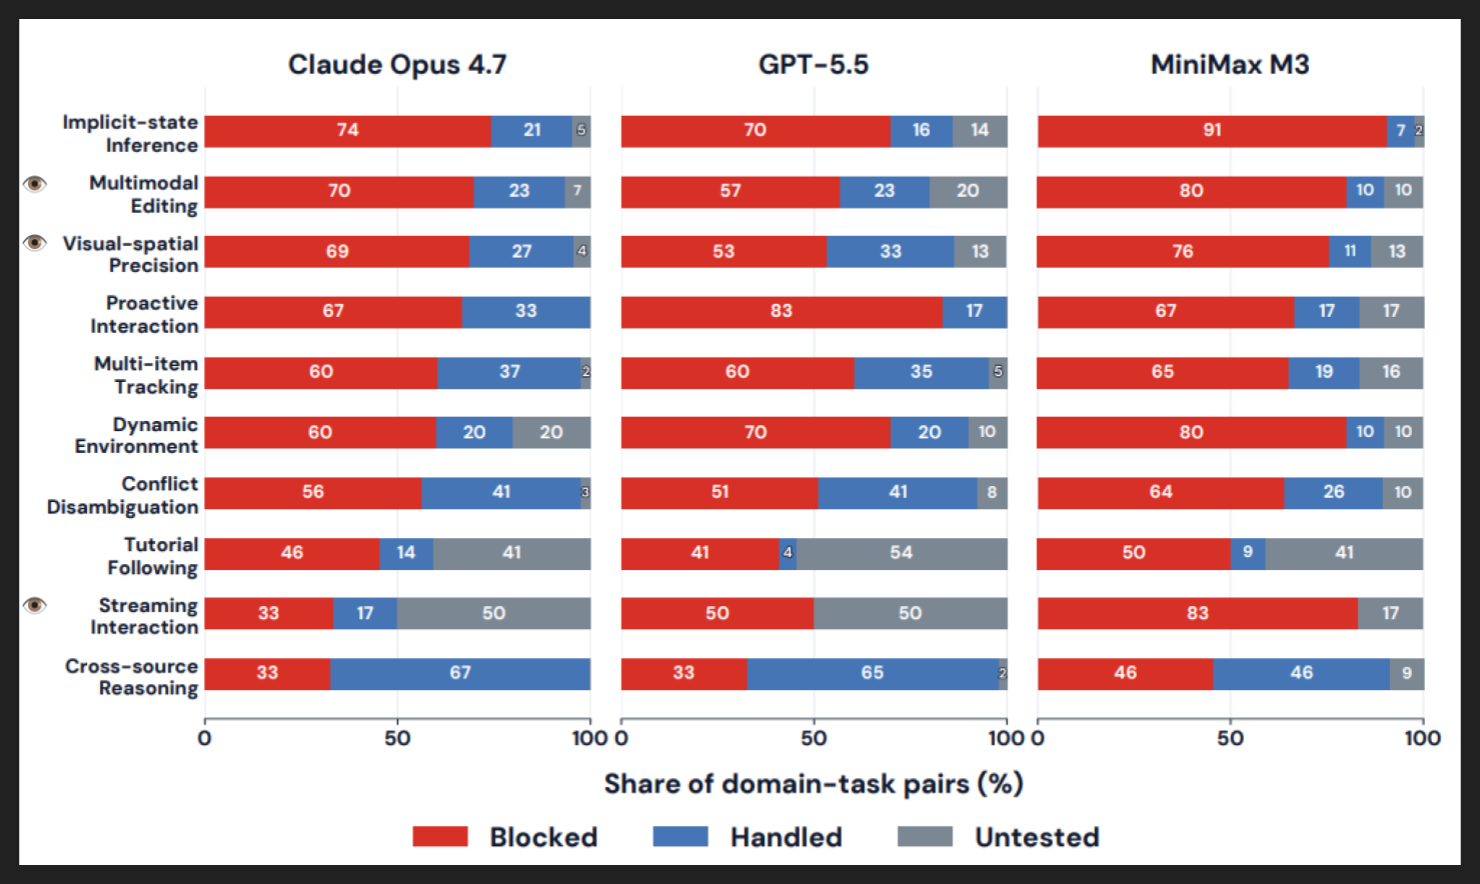
Continuing on the micro analysis, the authors revisit their taxonomy of “challenge phenomena” and see which phenomena are indeed the most challenging.
Now they don’t make this split in the paper, but I want to distinguish strongly visual tasks from the rest of them, because visual acuity is distinct from the general focus and planning the rest of the challenge phenomena test.
And you can see it right away in the differences between models. Among the three here, GPT is known to have the best vision abilities, and M3 the worst, which we see reflected in the results of the top two vision-heavy phenomena.
If we put them aside, then, we see pretty consistent results across most of the phenomena. Like apparently deriving implicit information and knowing when to ask the (simulated) user for clarification and keeping lots of things in working memory and noticing changes in the environment that are crucial for the task are all significant hurdles. It’s not an issue to work across multiple programs or artifacts per se, it’s more about keeping them all straight at the same time and knowing where the holes are. Gaia2, another updated version of an early agentic benchmark that I covered somewhat recently, drew some similar conclusions.
So like a relatively easy OSWorld 2.0 task might jump between a few different programs but only require one at a time, with little cognitive overhead or state to mentally keep track of. Like the expense report example from the top, if all you have to do is hunt across email and local files and Slack but each expense is self-contained and can go into the expense tracker one by one, that can be quite long but apparently not that challenging. It’s only when you add in new emails mid-stream, or conflicting sources of information, or a clear hole like a return plane ticket without a departing plane ticket, that you really start to challenge frontier models.
One final note: the easiest challenge phenomena, Cross-resource Reasoning, is actually the most common. It seems to me more like an intrinsic part of the benchmark to work across sources rather than a wrinkle to add in for increased difficulty.
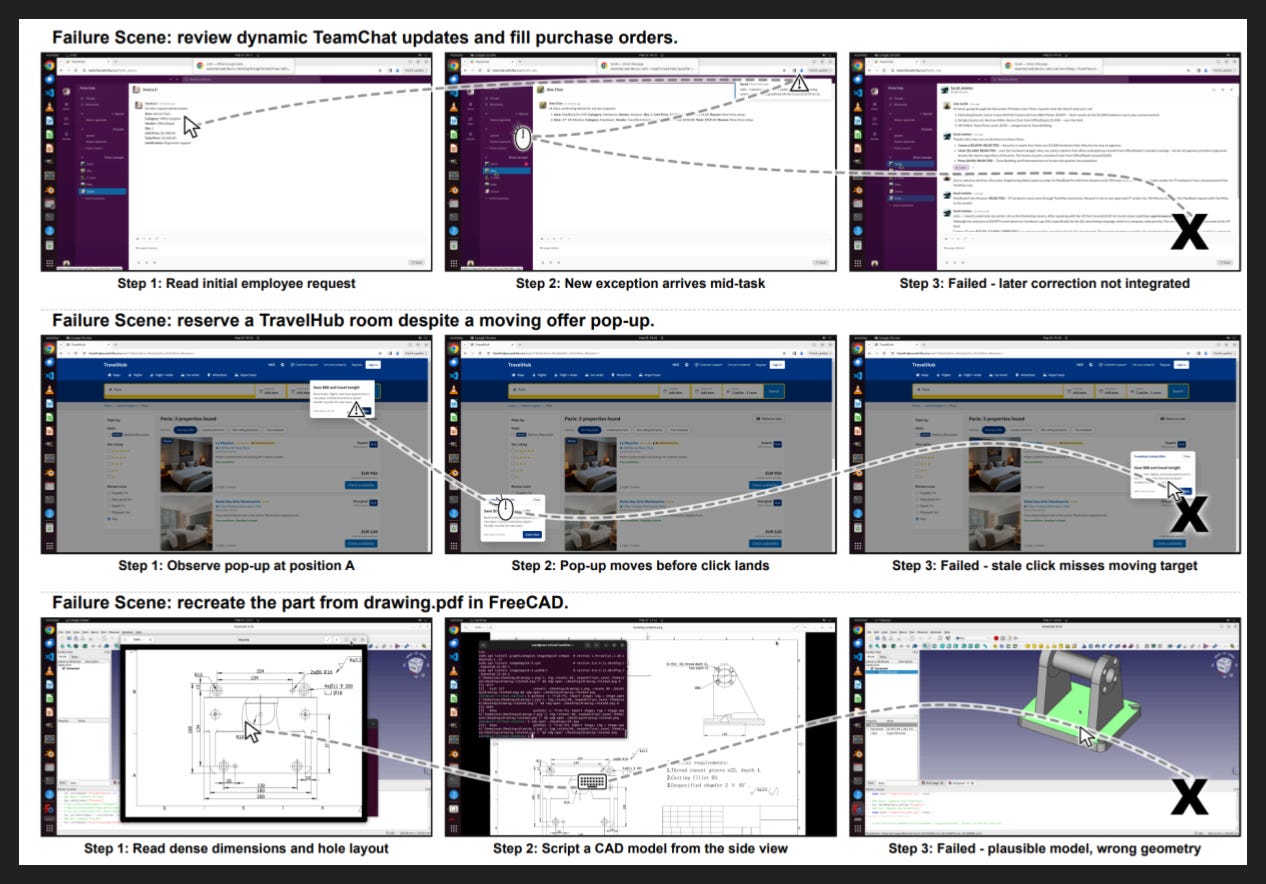
To make the failures concrete, here are a few examples.
The first one is an example of Dynamic Environment, where a new Slack message with corrected information goes unnoticed or unused.
The second one shows Streaming Interaction, where a pop-up moves and eludes the clicks from the agent. Personally I found this one pretty contrived.
The third one is Multimodal Editing, which explicitly includes CAD reconstructions. Even though the agent can use the software perfectly, it misperceives the plans and thus produces the wrong part model.
My Takeaways
2026 is the Year of Computer Use Agents
2025 actually was the Year of Agents
Now that models are good agents, labs can focus on computer use specifically
Anthropic probably released Sonnet 5 for computer use
I predict an agent will cross 50% on OSWorld 2.0 by EOY 2026
CUA data should be hot
Plenty of YC companies working on it already
Snorkel AI contributed to OSWorld 2.0
More benchmarks will tie themselves to economic indicators
For many applications, the era of science is over and the era of deployment has begun, which means dollars come into play
See my breakdown of Agents’ Last Exam
Interactive benchmarks will become more common for agents
Fully specified and self-contained tasks do not reflect how users work with agents
See Scale’s recent SWE-Interact for another example
Ive been making cua since 2015 mine are getting pretty wild 😜